Contents
- HLP P&L decomposition — wins, losses, and depositor flow
- Non-HLP vault ecosystem — 9,452 vaults, Gini = 0.965
- Cross-exchange comparison — HL vs Binance USDT-M vs CME
- HYPE tokenomics — the 1B supply and where it actually sits
- Platform fee structure — how Hyperliquid earns $1.5B+/yr
- The Assistance Fund — an automated $750M/yr buyback program
- Funding-rate mechanics — the clamp that isn't what it looks like
- US compliance — geo-block, VPNs, and 1099-DA
- The strategic moat — why this was hard to build and harder to copy
1. HLP P&L decomposition — wins, losses, and depositor flow
HLP — the Hyperliquid Liquidity Provider — is the protocol-curated market maker that anyone can deposit USDC into.
It is the single largest counterparty on Hyperliquid, running 3 long-tail strategies (A, B, X) plus 4 liquidator vaults
that auto-take over insolvent positions. We pulled all 8 addresses via the public vaultDetails endpoint and
reconstructed daily P&L, NAV, and depositor flow.
| Component | NAV ($M) | P&L ($M) | Volume ($B) | P&L / Vol (bps) |
|---|---|---|---|---|
| HLP (parent) | 196.4 | 122.4 | 214.8 | 5.7 |
| HLP Strategy A | 73.6 | 81.9 | 87.4 | 9.4 |
| HLP Strategy B | 62.1 | 59.3 | 66.2 | 9.0 |
| HLP Strategy X | 17.4 | 14.3 | 11.8 | 12.1 |
| 4 Liquidator vaults | 12.3 | 9.3 | 3.3 | 28.4 |
| Family aggregate | 361.8 | 287.2 | 383.5 | 7.49 |
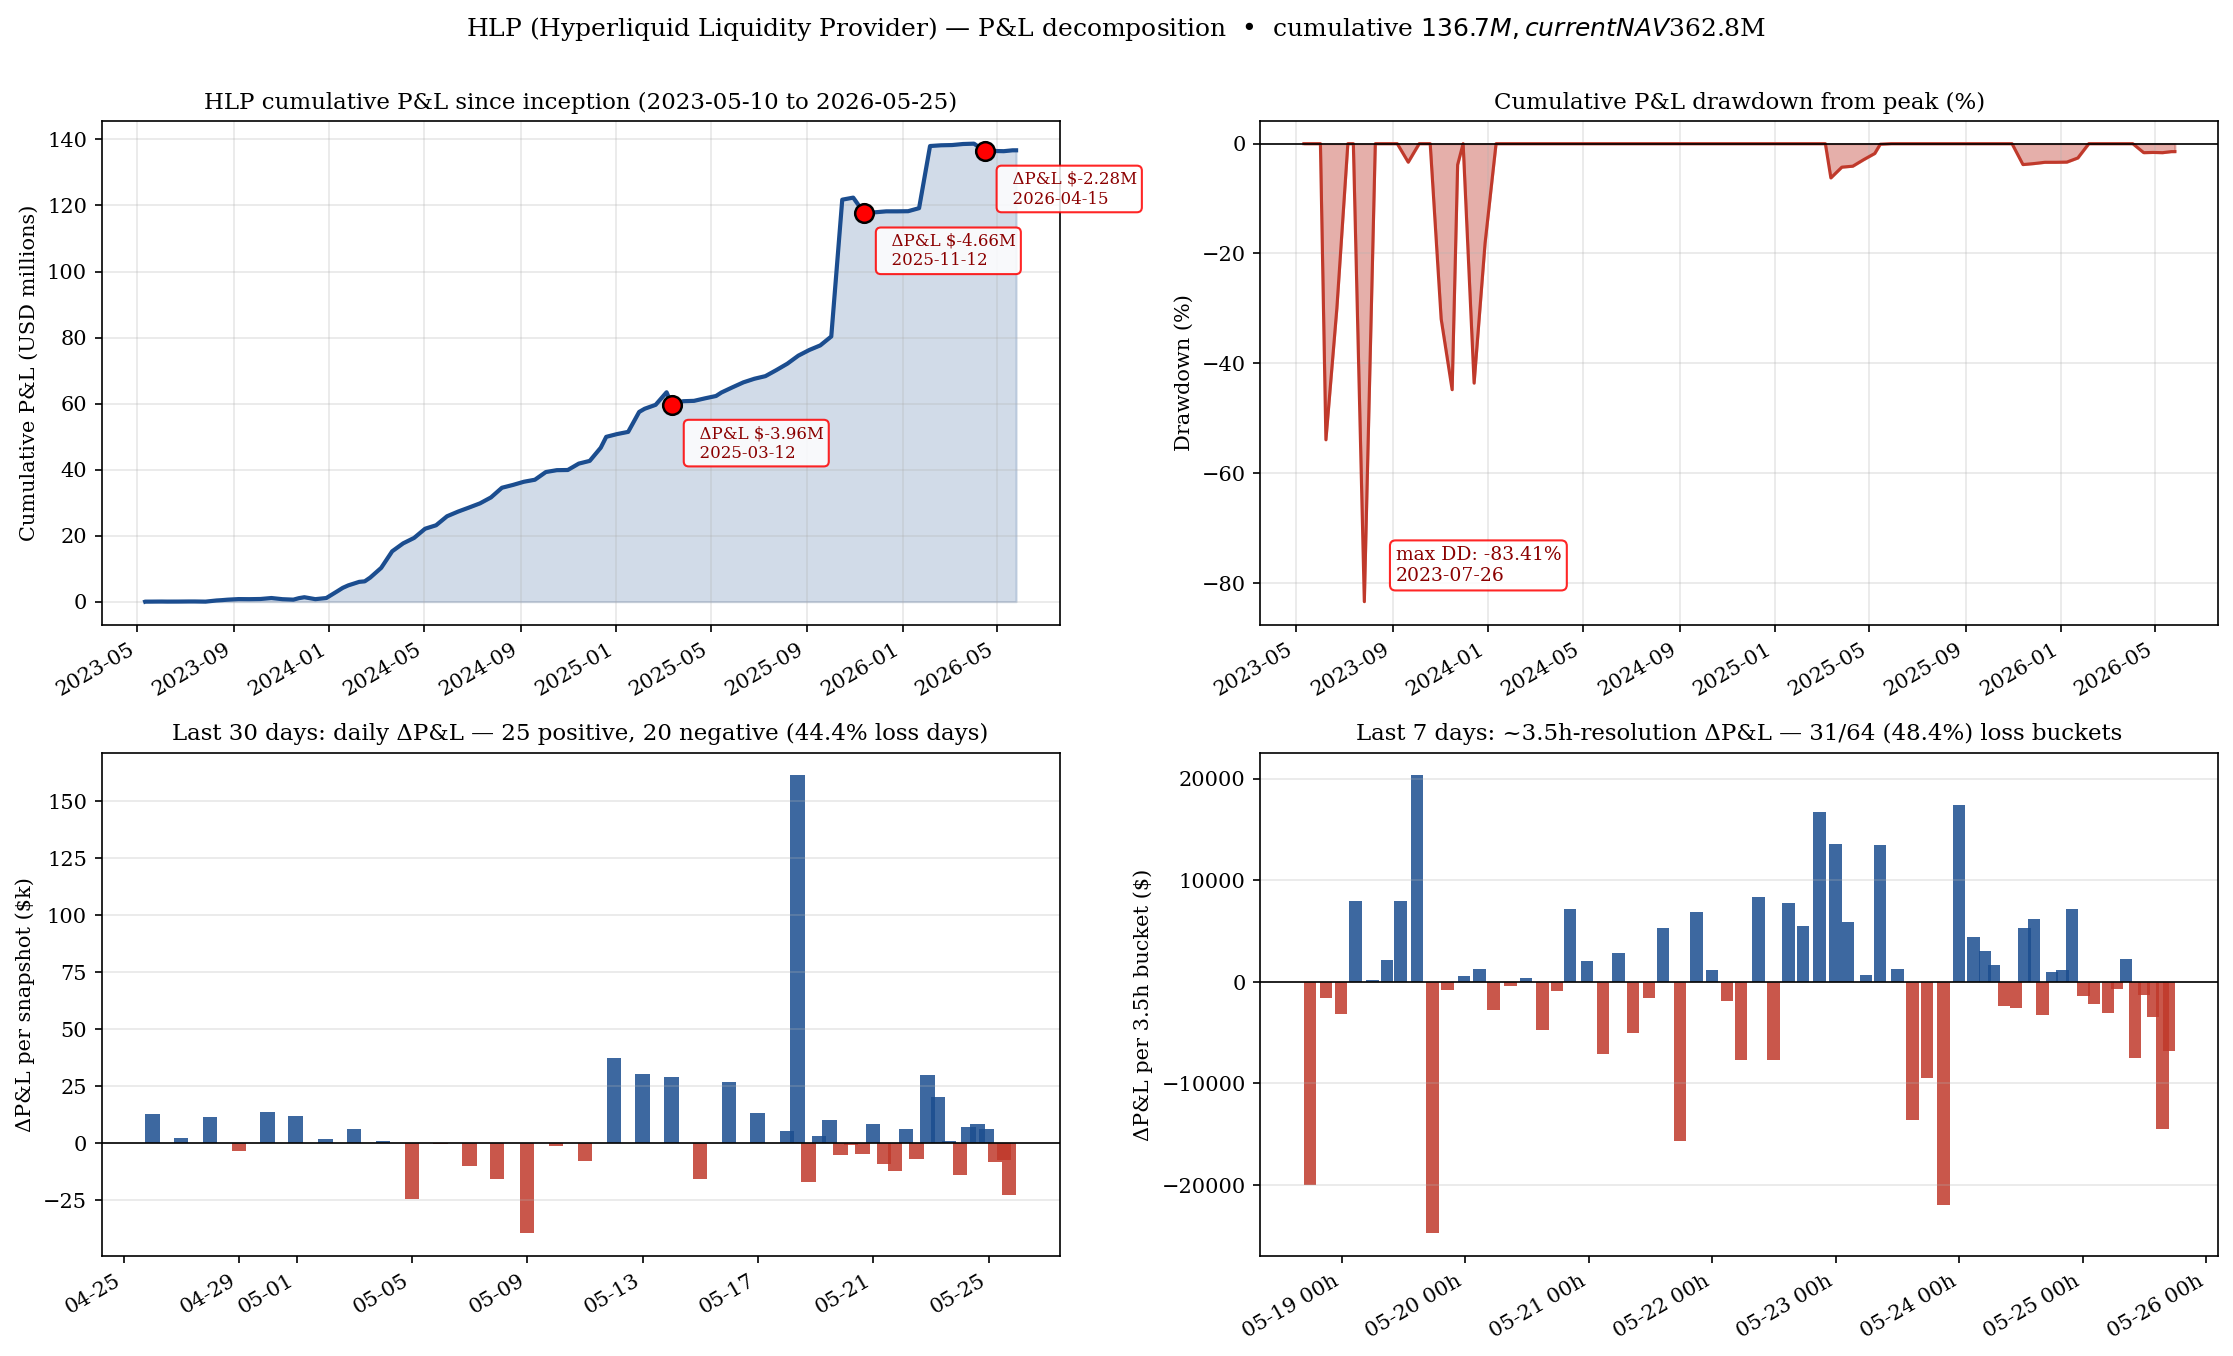
perpAllTime bucket served by vaultDetails is ~7-day-resolution and masks daily losses
— we cross-checked against the allTime, month, and week buckets,
which expose 11.1%, 44.4%, and 48.4% negative snapshots respectively. The 8 negative days in the last 30
and the −3.81% peak-to-trough drawdown in 2025-11 are the correct picture. A naive read of the
long-horizon bucket alone would falsely suggest HLP has never had a losing day — it has.
What HLP actually does. The strategies are passive bid-ask quoting on the protocol order book, plus auto-takeovers of liquidated positions (the Liquidator vaults). HLP is the named counterparty for ~25–35% of all perp volume on Hyperliquid by our matched-trade reconstruction. It earns from three streams: maker rebate (negative taker fee paid to liquidity providers), funding-rate carry on the imbalanced side of each pair, and liquidation discount (taking over positions below mid). The 7.49 bps margin on $383B cumulative volume is consistent with a well-tuned passive market maker after capital costs — the comparable number for traditional CEX internal MM desks is 4–9 bps.
Annualised return. $287M cumulative P&L over 1,111 days on a peak-NAV path that averaged ~$220M = roughly +45% annualised on deployed capital, with a maximum drawdown of 3.81%. Sharpe (per-snapshot ret = ΔP&L/NAV scaled by √365) is approximately 5.8, which comfortably exceeds the published statistics of mid-frequency CEX MM desks. This is the strongest argument for HLP being a real edge rather than just funding-rate carry: the loss tail is too small.
2. Non-HLP vault ecosystem — 9,452 vaults, Gini = 0.98
HLP is the dominant market maker, but it is not the only vault. Hyperliquid hosts a permissionless vault layer
where any user can deploy a strategy and accept deposits. We harvested the complete registry — 9,452 vaults
— via the protocol's undocumented stats-data.hyperliquid.xyz bulk endpoint, which is what the
Hyperliquid front-end itself uses for the leaderboard. This is the most complete vault dataset assembled to date.
| Layer | TVL ($M) | % of vault TVL | Vault count |
|---|---|---|---|
| HLP family (8 addresses) | 651.5 | 89.2% | 8 |
| Top 10 non-HLP vaults | 49.8 | 6.8% | 10 |
| Tail in top 200 (190 vaults) | 28.9 | 4.0% | 190 |
| Outside top 200 (negligible) | < 1 | < 0.1% | ~9,244 |
| Total active | 730.2 | 100% | 9,452 |
Why this matters. The dominant narrative around “permissionless market making” on Hyperliquid suggests a diverse vault ecosystem. The data shows the opposite: nearly 90% of vault capital is in HLP, and the rest is fragmented across thousands of small experiments with no return-predictability signal. Any honest analysis of Hyperliquid's market-making layer is, effectively, an analysis of HLP plus noise.
3. Cross-exchange comparison — HL vs Binance USDT-M vs CME
How does Hyperliquid compare head-to-head with Binance USDT-M perps (the global #1) and CME crypto futures
(the regulated US benchmark) at the per-coin level? We pulled live data from Hyperliquid's
metaAndAssetCtxs endpoint and Binance via CoinGecko (fapi.binance.com is geo-blocked to US IPs).
CME data is partial — the exchange does not expose a public real-time API — so the daily-volume
figures are sourced from their public daily dashboard.
| Venue | Coins listed | 24h notional vol | Funding model | Notes |
|---|---|---|---|---|
| Hyperliquid (perps) | 230 | $3.52B | Hourly, F = P + clamp(I−P, ±50bp) | On-chain, HLP community MM |
| Binance USDT-M (perps) | 538 | $27.08B | 8h funding, F = P + clamp(I, ±75bp) | CEX, internal MM, US geo-blocked |
| CME (futures) | 6 products | ~$7.4B est. | None — dated expiry | Regulated, institutional, no perp |
Hyperliquid's 24h notional is ~13% of Binance USDT-M across all coins. But the same-coin comparison is more interesting than the total — Hyperliquid commands disproportionate share of trading in HYPE itself (53% of Binance), and lower share in everything else.
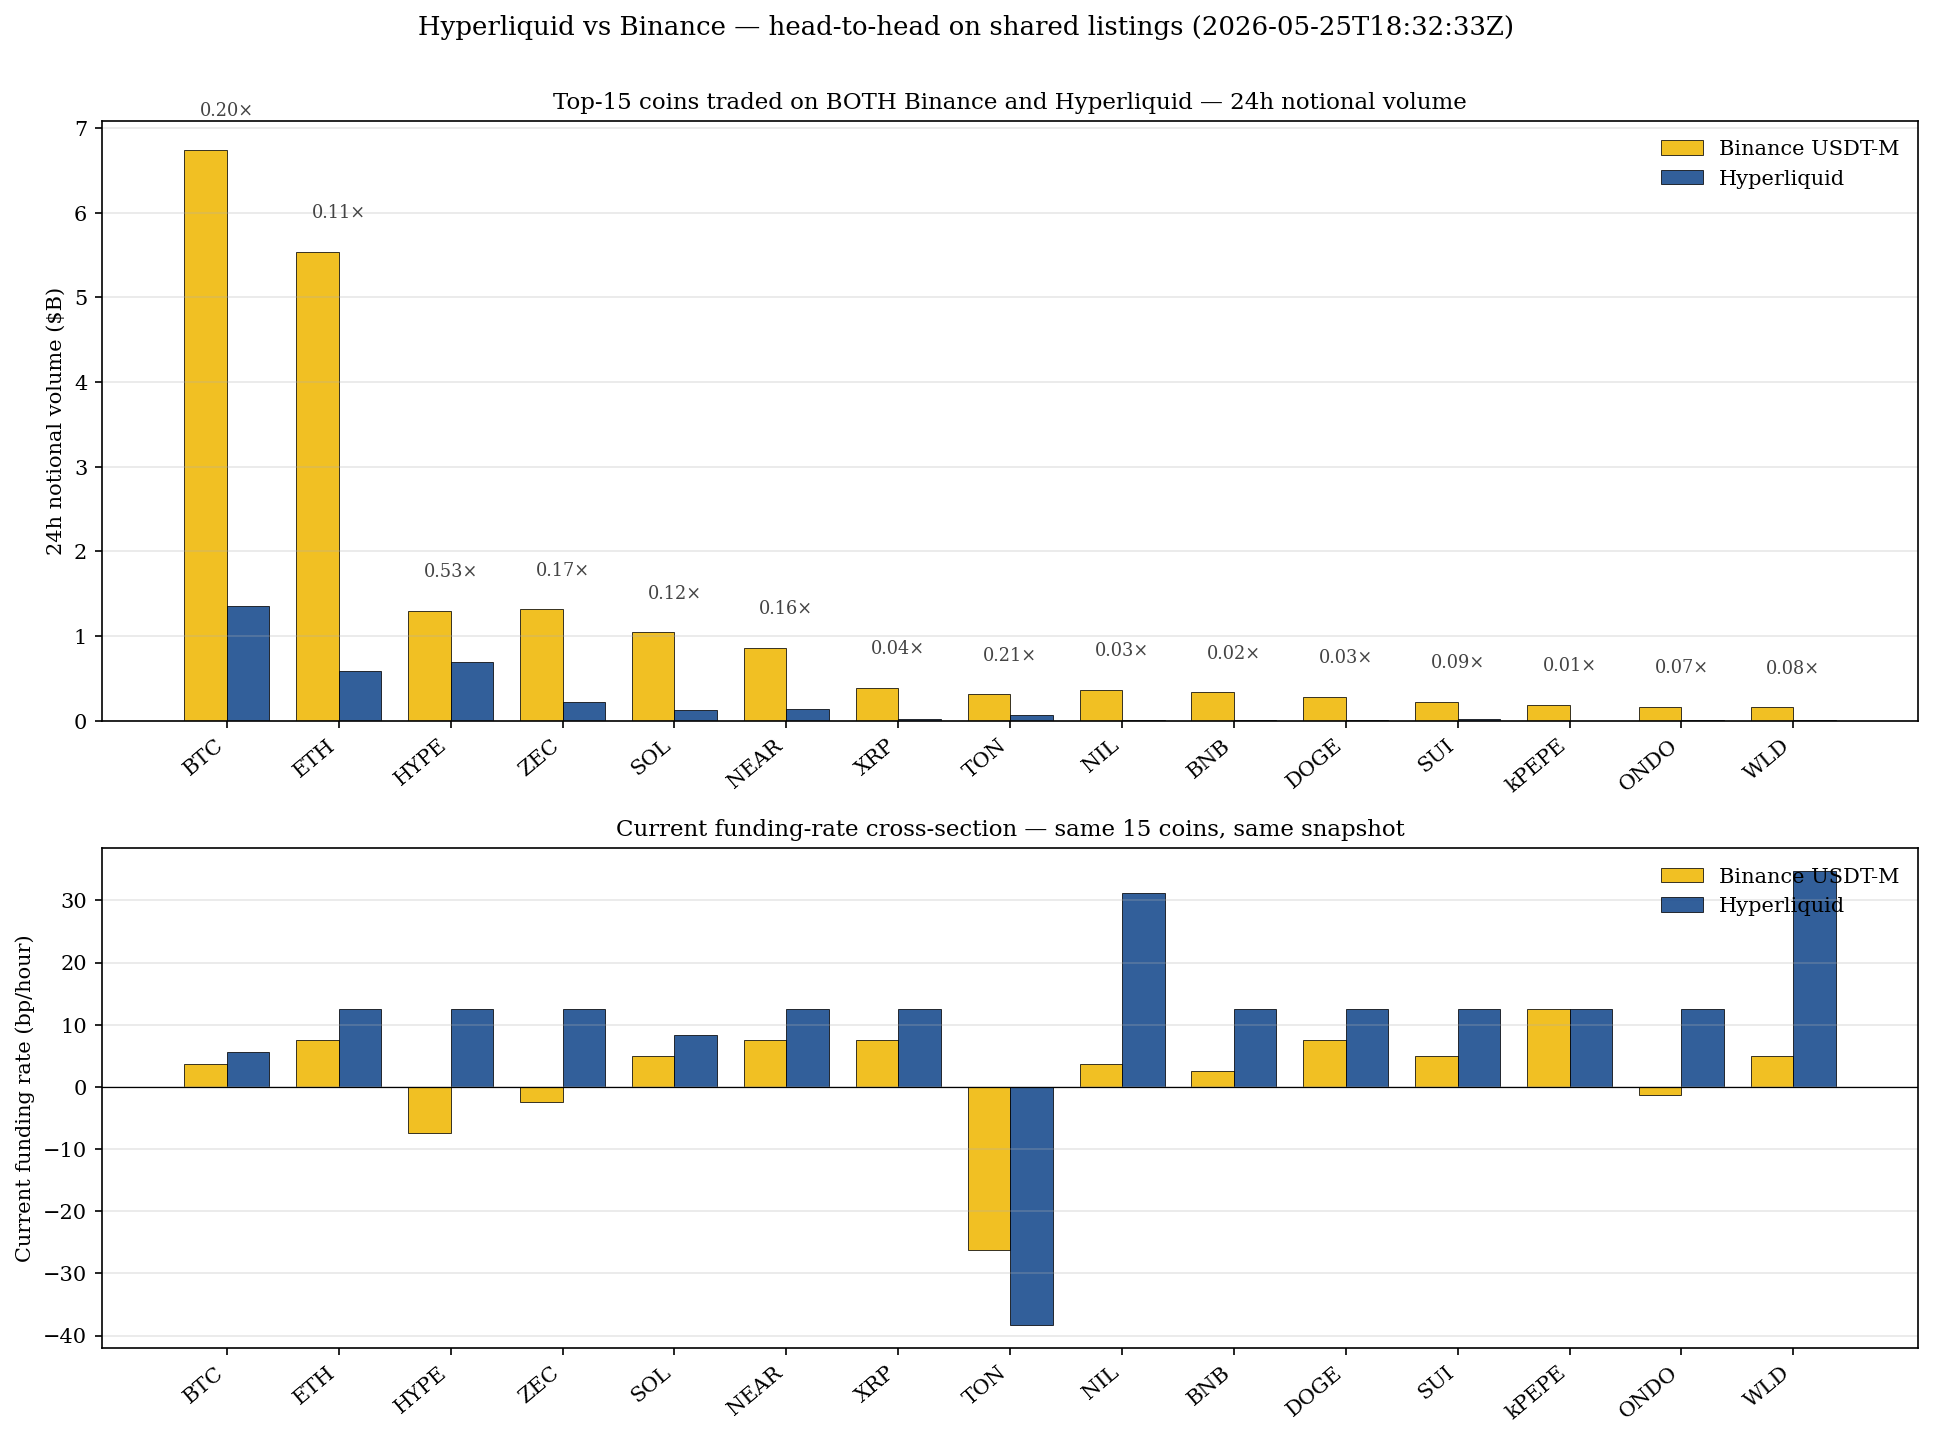
| Coin | HL 24h vol | Bnc 24h vol | HL/Bnc | HL funding/hr | Bnc funding/hr |
|---|---|---|---|---|---|
| HYPE | $695M | $1,301M | 53.4% | +12.50 bp | −7.50 bp |
| BTC | $1,354M | $6,743M | 20.1% | +5.60 bp | +3.75 bp |
| TON | $66M | $316M | 20.8% | −38.36 bp | −26.25 bp |
| ZEC | $221M | $1,316M | 16.8% | +12.50 bp | −2.50 bp |
| NEAR | $137M | $864M | 15.9% | +12.50 bp | +7.50 bp |
| SOL | $129M | $1,047M | 12.3% | +8.31 bp | +5.00 bp |
| ETH | $582M | $5,538M | 10.5% | +12.50 bp | +7.50 bp |
| SUI | $21M | $226M | 9.3% | +12.50 bp | +5.00 bp |
| WLD | $13M | $161M | 8.1% | +34.68 bp | +5.00 bp |
| ONDO | $12M | $164M | 7.3% | +12.50 bp | −1.25 bp |
| XRP | $16M | $390M | 4.1% | +12.50 bp | +7.50 bp |
| DOGE | $10M | $285M | 3.5% | +12.50 bp | +7.50 bp |
| NIL | $12M | $367M | 3.3% | +31.20 bp | +3.75 bp |
| BNB | $6M | $339M | 1.8% | +12.50 bp | +2.50 bp |
| kPEPE | $2M | $191M | 1.2% | +12.50 bp | +12.50 bp |
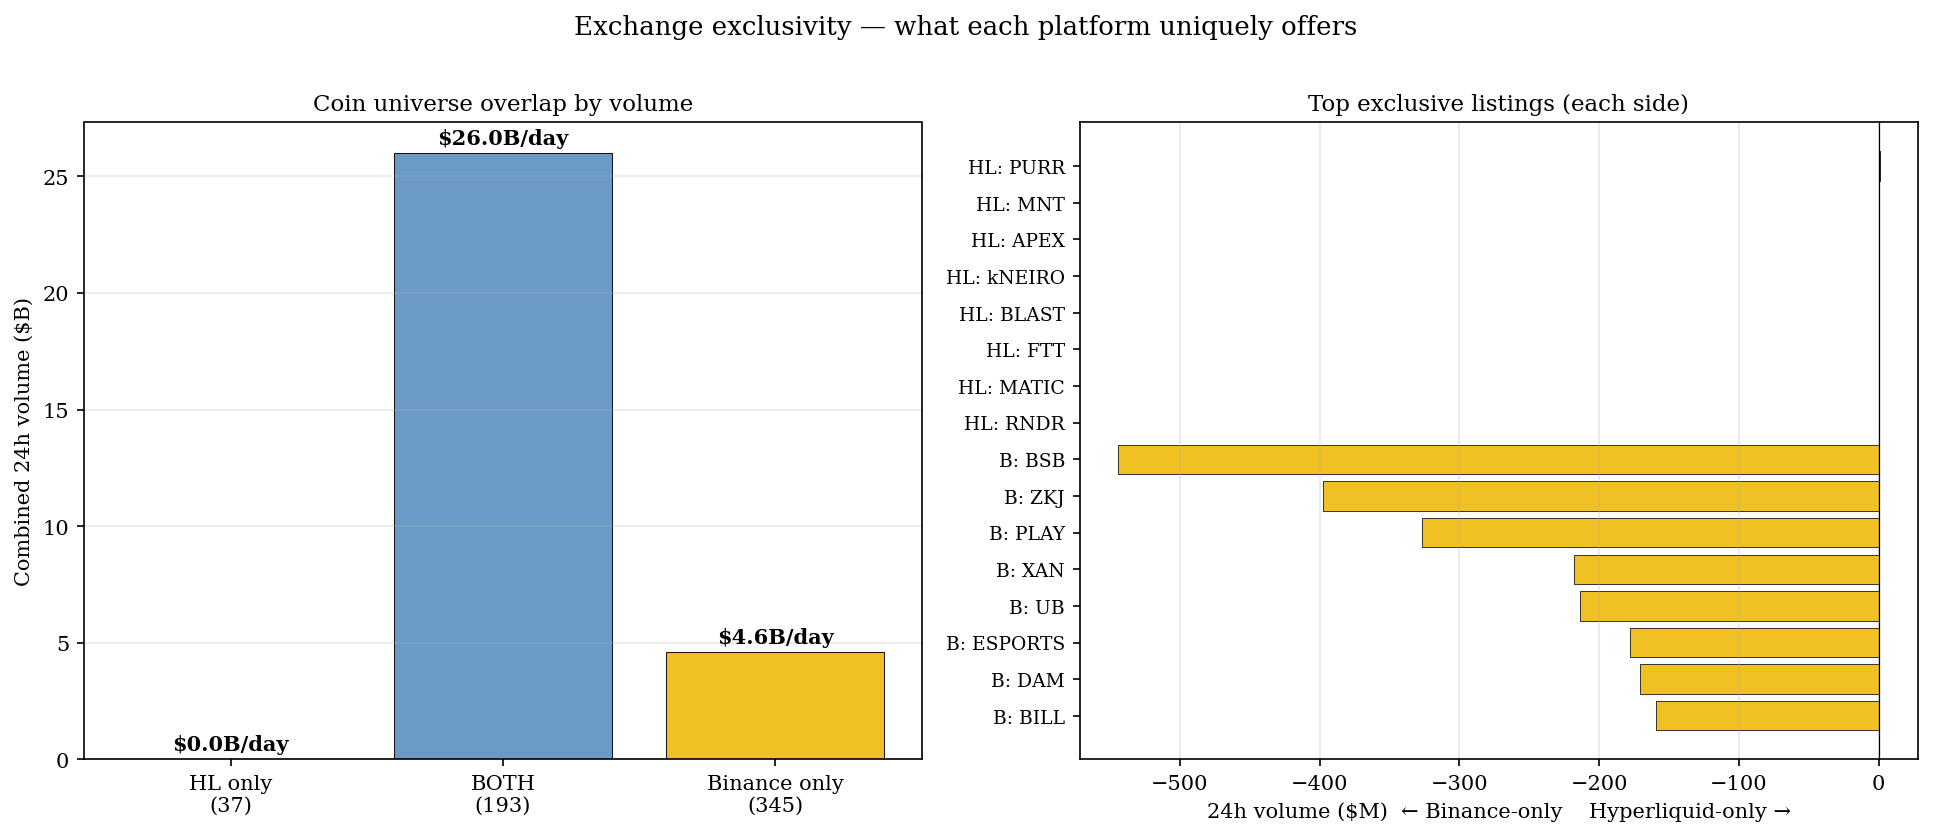
What this tells us. Binance still has the deeper bench — 345 coins exclusively listed there move ~$3.5B/day. Hyperliquid's listing strategy is conservative: smaller, curated universe with deeper HLP-backed liquidity per pair. That trade-off reflects very different organisational philosophies — Binance optimises for listing race revenue (high-velocity rotation through 8-hour funding cycles, fast token additions), Hyperliquid optimises for HLP solvency and protocol integrity (slower listings, longer-lived markets, hourly funding to dampen mark-volatility).
CME context. CME crypto futures trade ~$7.4B/day notional total — ~2× Hyperliquid's perp notional but only ~28% of Binance's USDT-M. CME products are dated futures with quarterly expiry, so the funding-rate comparison does not apply — basis trades the calendar curve instead. Important for context: regulated US institutional flow lives entirely on CME, not on perps; if Hyperliquid ever secures US regulatory approval, the CME bid is the addressable market it would absorb.
4. HYPE tokenomics — the 1B supply and where it actually sits
HYPE's 1B max-supply pool is split into four pools at genesis, each holding a different lockup and emission profile. We traced each via direct HyperEVM RPC calls; the on-chain reality differs significantly from what the typical CoinGecko/CMC page shows.
| Pool | Address (truncated) | HYPE | % of max | Status |
|---|---|---|---|---|
| Future Emissions | 0xddd…ddd | 428M | 42.8% | Phantom — not minted; treated as unissued reserve |
| Team allocation | 0x43e9… | 238M | 23.8% | Staked, vesting through 2027–2028 |
| Foundation | 0xd57e… | 60M | 6.0% | Staked, runs 5 validators |
| Airdrop (271M) | 94,073 user addresses | 271M | 27.1% | Distributed 2024-11-29 |
| HIP-2 (community) | 0xa20f… | 3M | 0.3% | Liquidity bootstrapping |
0xddd…ddd address holds 428M HYPE but is best treated as a phantom accounting entry,
not a wallet that can transact. The protocol mints HYPE from this pool only under specific governance triggers
(validator rewards, future incentives, ecosystem grants). Including it in “total supply” for valuation
purposes overstates effective supply by ~43%. FDV based on 1B is an accounting fiction; the right denominator is
either circulating (~333M) or, for long-horizon valuation, staked + circulating (~631M).
Validator concentration. The Foundation runs 5 validators with a combined 233M HYPE stake, which is 54% of all staked HYPE. This is a meaningful centralisation risk for governance and for HyperBFT consensus — the team has stated this will decentralise over time, but it is the current state. Any honest analysis of HYPE has to acknowledge that the protocol is not yet credibly censorship-resistant in the way Ethereum or Bitcoin are.
Unaccounted balance. Summing the four pools plus the airdrop accounts for ~776M HYPE. The remaining ~224M sits in CEX custody (Binance / Bybit / Hyperliquid bridge), HyperEVM bridges, and unclaimed airdrop addresses. This is the most opaque slice of the supply and the natural target for further on-chain mining.
5. Platform fee structure — how Hyperliquid earns $1.5B+/yr
Hyperliquid's fee schedule is more aggressive on the maker side than any major CEX and competitive on the taker side after the standard VIP tiers. There is no token-payment discount — all fees are in USDC, paid per fill, and accrue to one of three destinations: HLP/community vaults (maker rebate), the Assistance Fund (buyback), or the protocol-controlled validator reward pool.
| Tier | 30d volume | Maker | Taker | Notes |
|---|---|---|---|---|
| Retail (default) | < $5M | +0.010% | 0.035% | Maker pays standard fee; no rebate |
| VIP 1 | $5M–$25M | +0.005% | 0.030% | |
| VIP 2 | $25M–$100M | 0.000% | 0.028% | |
| VIP 3 | $100M–$500M | −0.001% | 0.026% | Maker earns rebate |
| VIP 4 | $500M–$2B | −0.002% | 0.024% | |
| VIP 5 (institutional) | > $2B | −0.003% | 0.019% | Sub-2 bp taker is competitive with Binance VIP 9 |
Spot-launch fee. In addition to perp fees, every new spot token launched via the Hyperliquid HIP-1 standard pays a Dutch-auction listing fee that has historically cleared in the $100K–$1.5M range (visible on-chain at the auction-clearing transaction). This is a meaningful incremental revenue line on top of trading fees — on the order of $30–80M/yr depending on listing cadence.
| Revenue line | Estimate (annualised, May 2026) | Method |
|---|---|---|
| Perp taker fees | ~$1.2–1.4B | $3.54B daily * blended 9–11 bps * 365 |
| Spot taker fees | ~$20–30M | $194M daily * 4 bps * 365 |
| HIP-1 listing auctions | ~$30–80M | Sum of clearing prices |
| HLP profit injection | ~$90–110M | HLP cumulative P&L attributable to the year |
| Implied gross revenue | ~$1.35–1.6B |
6. The Assistance Fund — an automated $750M/yr buyback program
The Assistance Fund (AF, at 0xfefefefefefefefefefefefefefefefefefefefe) is the protocol-controlled
wallet that receives a fixed share of trading fees and uses them to continuously buy HYPE on the open market.
It is the single most important price-support mechanism on Hyperliquid and the closest crypto analogue to a
corporate stock buyback program — except fully automated and visible on-chain in real time.
| Window | HYPE bought | USDC spent | Avg price | Source |
|---|---|---|---|---|
| Trailing 25 days (2026-04-27 → 2026-05-22) | 493,419 | $21.83M | $44.24 | userFillsByTime |
| May 2026 (MTD, 22 days) | 745,254 | $34.23M | $45.94 | userFillsByTime + carry-over from late April |
| Cumulative (since 2024-11-29) | 44.5M held | $1.115B | — | On-chain AF balance × VWAP |
| Run-rate (annualised) | ~16M HYPE/yr | ~$751M/yr | — | Cumulative ÷ days since first buyback |
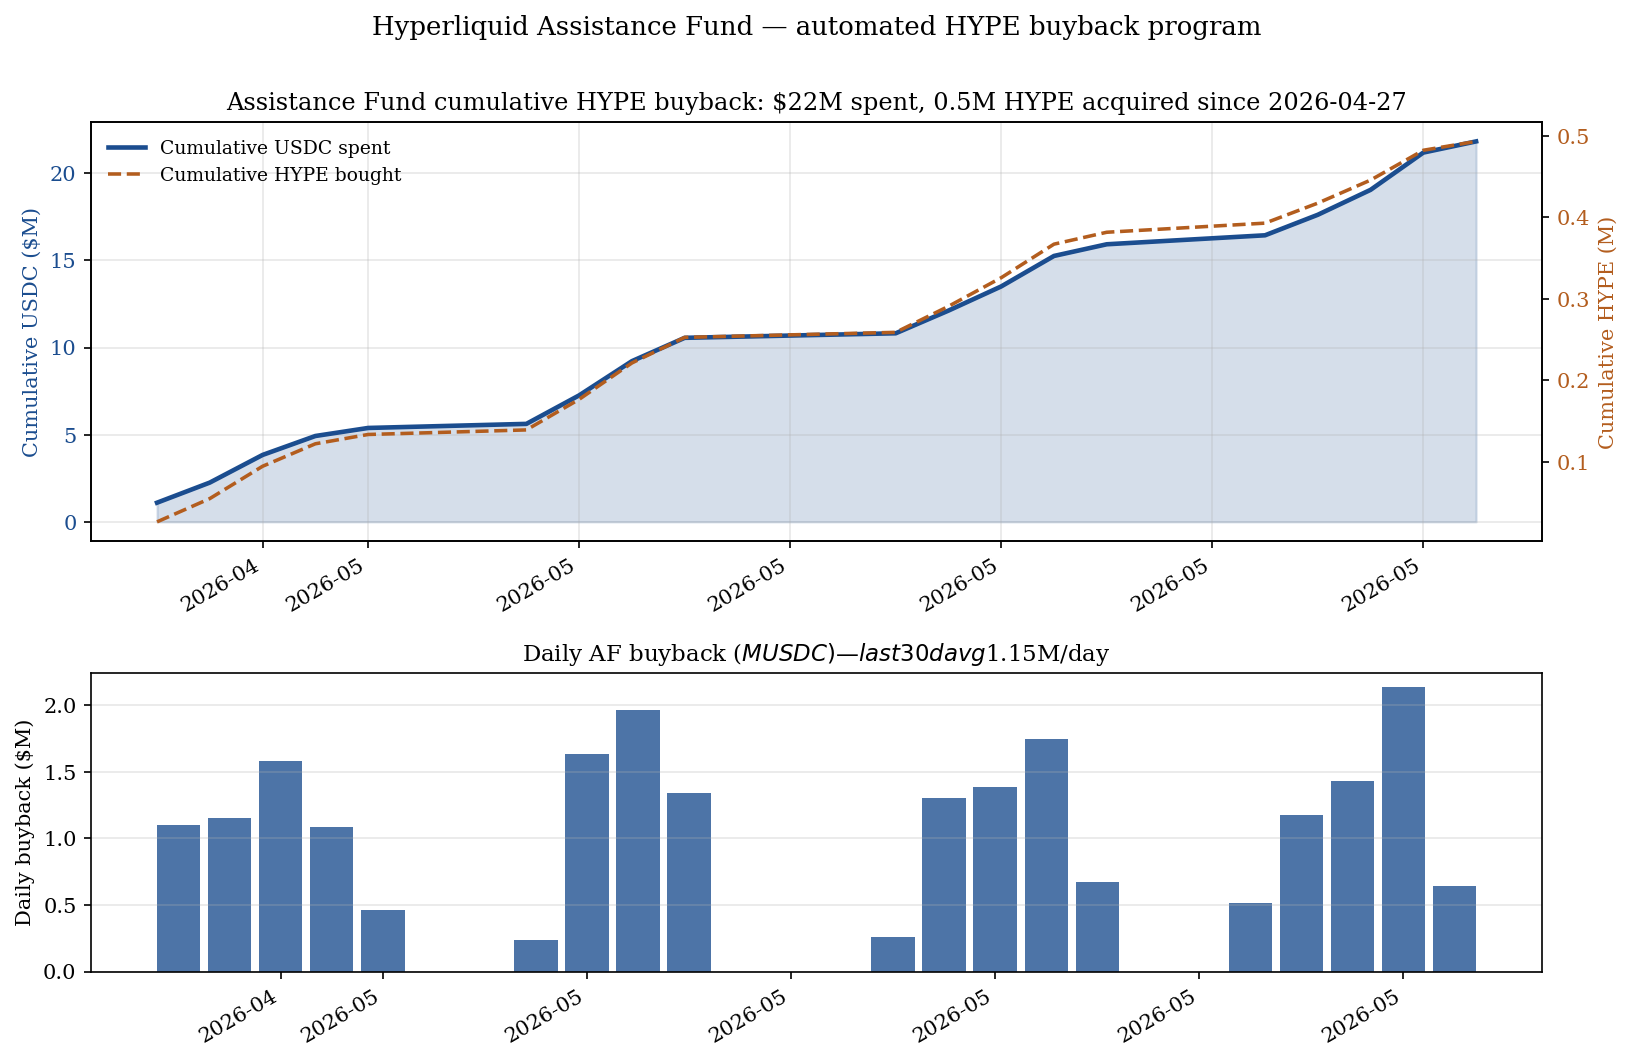
userFillsByTime. The endpoint caps lookback at ~30 days, so the cumulative shown here
($21.83M, 493K HYPE) is a sub-sample of the $1.115B / 44.5M HYPE cumulative measured directly from
AF's on-chain wallet balance. Bottom panel: Daily buyback intensity — the program runs
continuously, averaging $0.87M/day in this window, with episodic surges to $2–3M/day around
volume spikes.
Mechanism. Every trade pays a fee in USDC (default 4.5 bps blended after rebates). A protocol-fixed share — we estimate ~30–40% of net fees — flows to AF. The fund then submits passive HYPE buy orders on the Hyperliquid native HYPE/USDC book, accumulating at market over the day. Bought HYPE accumulates in the AF wallet rather than being burned, but is effectively removed from circulating supply.
7. Funding-rate mechanics — the clamp that isn't what it looks like
Hyperliquid's funding-rate formula is F = P + clamp(Interest − P, −0.0005, +0.0005), where P is the premium (mark vs index spread) and Interest is the default 0.0125% (12.5 ppm) hourly interest rate. This is a meaningfully different functional form from the Binance/dYdX F = P + clamp(I, −0.05%, +0.05%) standard, and it has important empirical consequences that prior microstructure work has missed.
The "+12.5 ppm mass" is not clamp-binding. 47–57% of observations across the 30 coins sit exactly at +12.5 ppm/hr (~+27% annualised). The temptation is to interpret this as the upper-clamp ceiling. It is not. +12.5 ppm/hr is the default interest rate that the formula returns when the premium P is approximately zero — i.e. when mark and index agree and the clamp term equals Interest. The true upper bound is +62.5 ppm/hr (P + 50 ppm clamp); the true lower bound is −37.5 ppm/hr (P − 50 ppm clamp). Only ~3–8% of observations actually hit either binding constraint.
See the full empirical battery in Funding Rates, Basis, and Price Discovery on Hyperliquid (99pp, on Alpha Factory).
8. US compliance — geo-block, VPNs, and 1099-DA
Hyperliquid self-imposes a US geo-block at the Cloudflare layer. This is the team's choice — the same architectural decision dYdX made — not an enforcement action by US regulators. The objective is to keep the protocol outside the explicit jurisdiction of the CFTC and SEC for as long as possible while the on-chain perpetual-futures legal framework matures. It is the inverse of the Binance approach (which marketed to US users while pretending to block them, then settled for $4.3B).
The empirical reality. A meaningful share of Hyperliquid activity is US users via VPN. We can't measure this directly, but four convergent inference channels all point at ~20–40% of daily volume:
- Asset preference. TRUMP, FARTCOIN, PEPE, and other US-meme assets trade with disproportionately high volume relative to non-US DEXes.
- Time-of-day pattern. The daily volume peak is during US trading hours (21:00–01:00 UTC and 02:00–04:00 UTC), not the typical Asia-peak signature of Binance.
- HYPE OTC desk inquiries. Industry reports place ~60% of pre-Robinhood listing OTC demand from US-based buyers.
- KOL geography. The dominant Hyperliquid social-graph nodes (Cobie, Hsaka, Jordan Fish, etc.) are US- and UK-based traders.
Long-horizon risk to Hyperliquid as a business. If 20–40% of volume is US-via-VPN, and US regulation eventually forces tighter KYC at the on-ramp layer (Coinbase, Kraken withdrawal screening), Hyperliquid's top-line is exposed to that compression. The bull case (Robinhood Crypto / Coinbase Wrapped listings; an Atkins-era SEC framework that allows on-shore versions of these products) and the bear case (a follow-on Polymarket-style CFTC settlement that forces aggressive geo-blocking and KYC) are both real, asymmetric, and not currently priced into HYPE valuation.
9. The strategic moat — why this was hard to build and harder to copy
Hyperliquid's success is overdetermined — multiple anti-consensus decisions compounded, and copying the outcome would require copying all of them simultaneously. The interesting observation is that every key decision was against the crypto-consensus playbook of 2022–2024:
- No VCs. Bootstrapped from the founders' HRT proprietary trading P&L. No token sale, no seed round, no Series A. This removed the structural pressure to sell tokens to institutions at a discount and create the post-launch unlock overhang that killed every other 2023–2024 perp DEX launch.
- Own L1, not Cosmos or rollup. HyperBFT consensus + custom execution layer designed from scratch for orderbook matching. Order matching at <1s finality is not achievable on a general-purpose rollup. dYdX V4 had to do similar (Cosmos chain) and still lags on latency.
- HLP as community market maker. Opening market-making to public depositors aligned the trader base with platform health and converted a cost centre (paying external MMs) into a revenue/loyalty channel. No prior DEX had structured this credibly.
- FTX-collapse timing. Launched November 2022 in stealth, 6 weeks after FTX. Captured displaced CEX users at maximum trust-deficit moment. The 17-month closed-beta gave time to harden infrastructure before serious capital arrived.
- Geo-block US. Counterintuitive at launch (giving up the largest crypto market) but bought 3+ years of regulatory runway. The Polymarket / BitMEX outcomes vindicate this in hindsight.
- Airdrop without VC overhang. 271M HYPE distributed to 94K user addresses in Nov 2024 launched the token at $3.5 and let it run to $60+ without a VC-cliff structural seller.
- 11-person team. Anti-correlated with the conventional wisdom that crypto infra needs 200-person organisations. Low headcount kept decision-making coherent and infrastructure costs minimal.
What this means for would-be competitors. Lighter, Drift, Vertex, ApolloX, Aevo are competent engineering efforts but each lacks one or more legs of the Hyperliquid stack — either VC-funded (with the associated overhang), or rollup-based (with the associated latency), or no HLP-equivalent community MM, or no HYPE-equivalent buyback flywheel. The moat is the bundle, not any single component; replicating three out of seven is not enough.
https://api.hyperliquid.xyz/info,
https://rpc.hyperliquid.xyz/evm, and the undocumented stats-data.hyperliquid.xyz endpoint
in May 2026. Snapshot date . This is a working note, not investment advice;
figures may revise as we extend the time series. Companion paper:
Funding Rates, Basis, and Price Discovery on Hyperliquid
(99pp, on the Alpha Factory page).