Contents
- The dataset — what 13TB of order books actually contains
- Spread compression — a 99% collapse
- Depth explosion — capital arrived alongside tight spreads
- Exchange head-to-head — one BTC, four liquidity regimes
- The volatility-spread nexus — stress days and what causes what
- Cross-asset correlation — trend bias vs real co-movement
- Market maturation — book symmetry and quote intensity
- What this means for execution today
- Methodology & limitations
1. The dataset — what 13TB of order books actually contains
We pulled L2 order-book snapshots from a historical crypto-market archive — every venue's full bid/ask ladder, sampled monthly at first-of-day across 4 venues × 6 USDT pairs. Coverage is uneven: Binance and OkEX dominate the panel; Bybit only entered with meaningful breadth in 2021. The asymmetry matters — any cross-venue ranking has to weight observation counts; within-venue time-series comparisons are clean.
| Exchange | ADA | BTC | DOGE | ETH | SOL | XRP |
|---|---|---|---|---|---|---|
| Binance | 181 | 198 | 137 | 198 | 98 | 179 |
| Bybit | 29 | 21 | 21 | 36 | 19 | 24 |
| Huobi | 181 | 191 | 146 | 191 | 86 | 191 |
| OkEX | 162 | 188 | 136 | 188 | 93 | 188 |
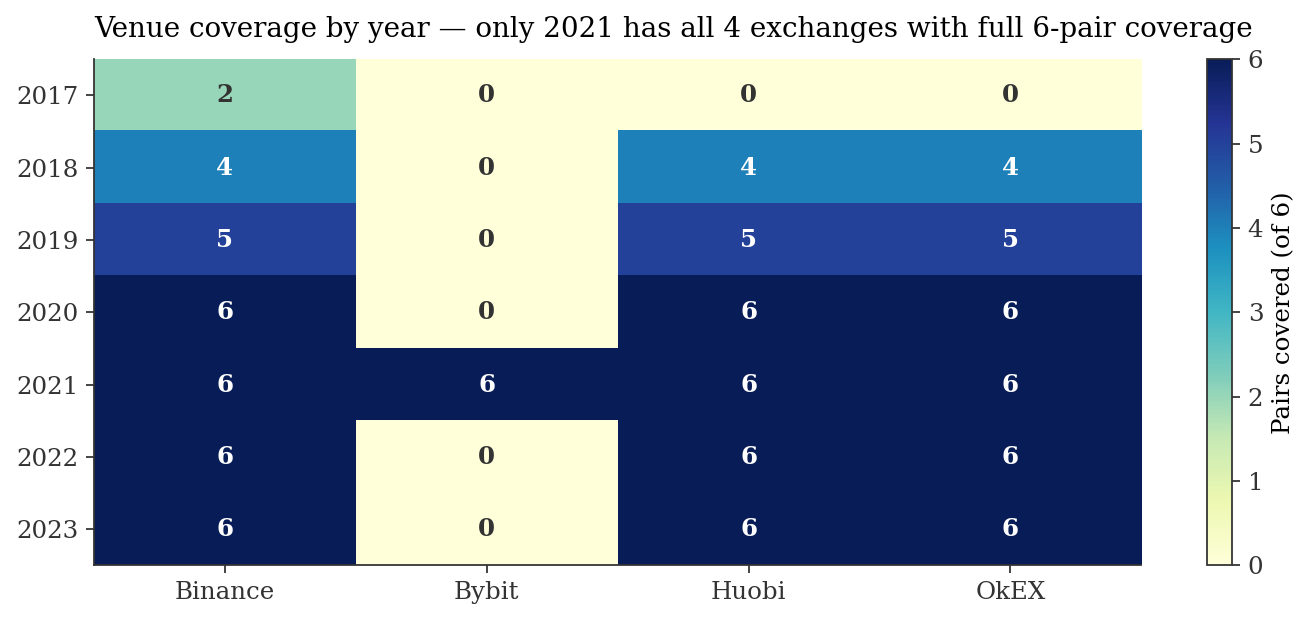
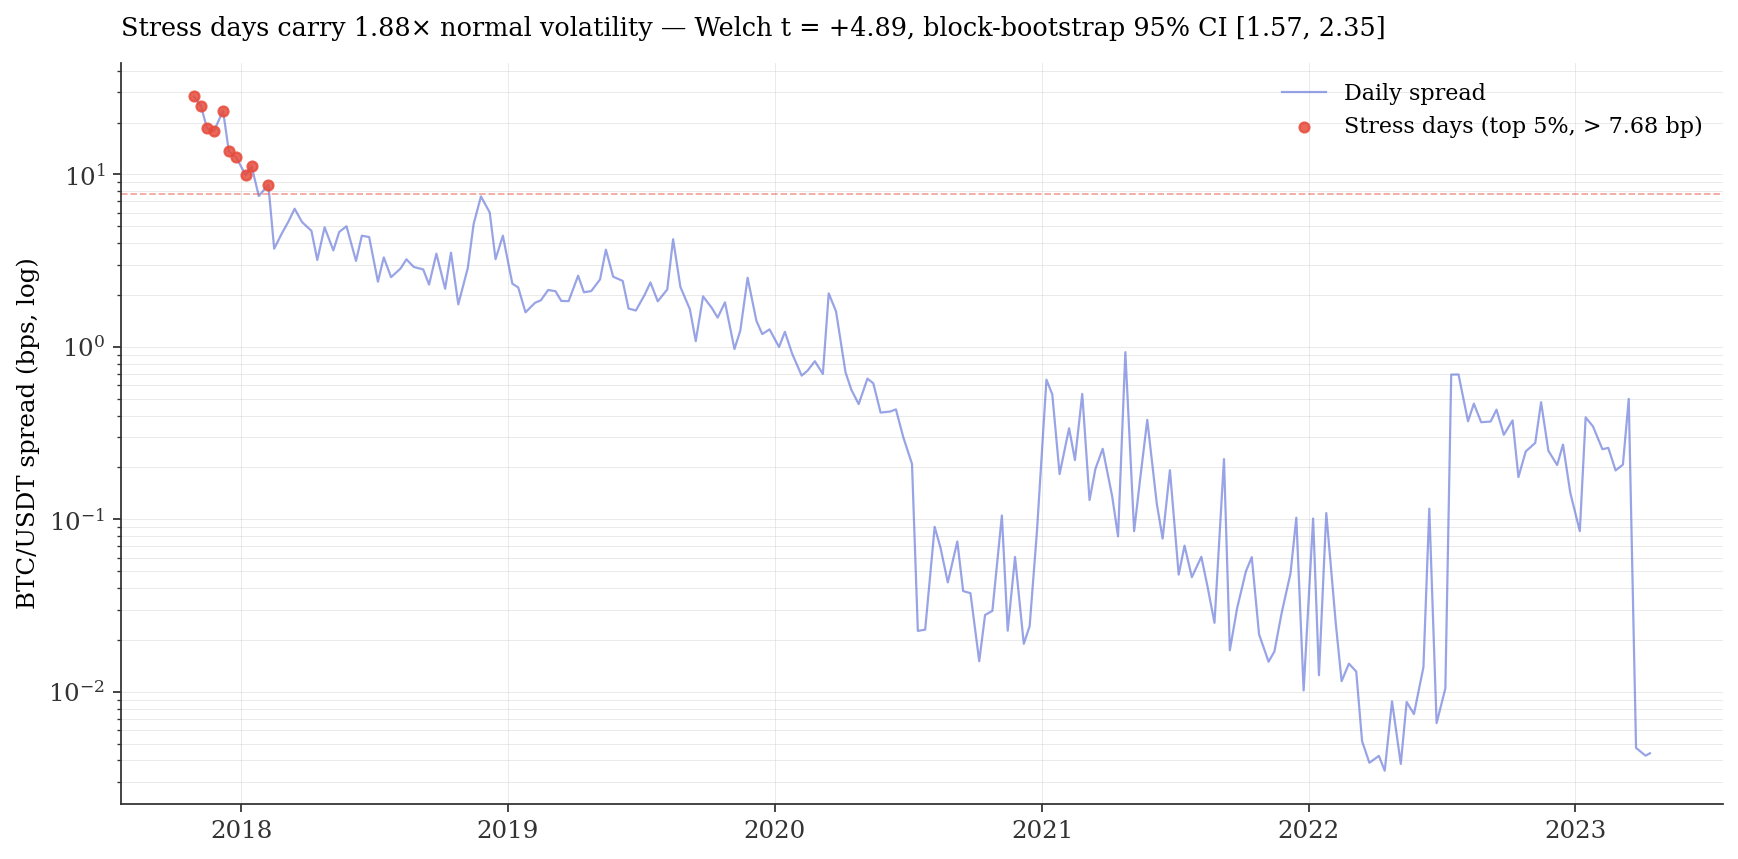
The full panel is 3,082 venue-day observations. Spread distribution: median 2.07 bps, mean 5.89 bps, max 312 bps — a log-normal right tail that the next section dissects.
2. Spread compression — a 99% collapse
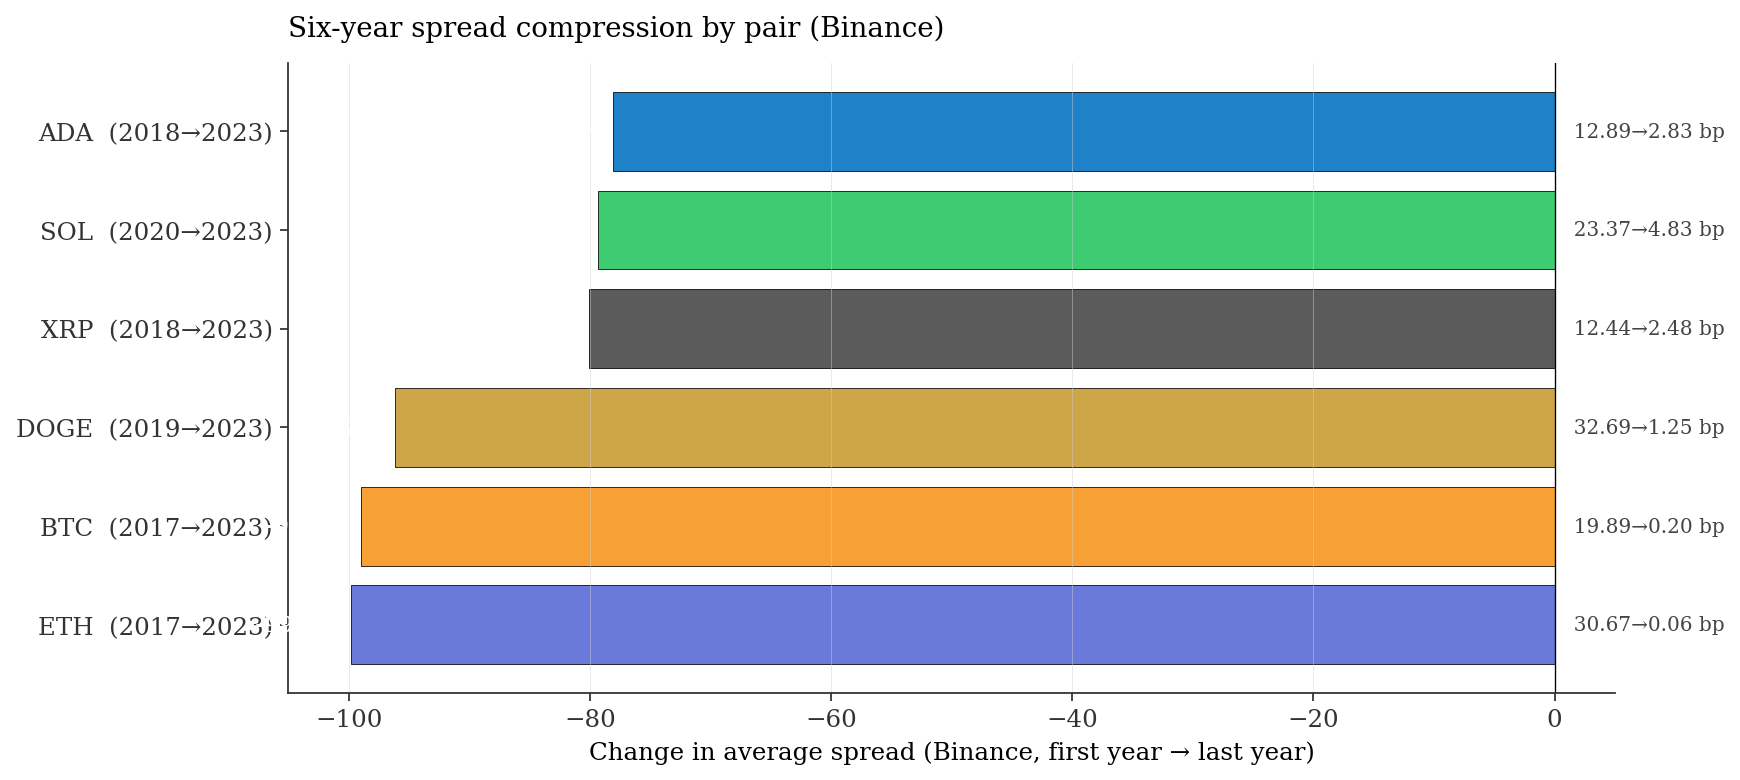
BTC/USDT on Binance traded at 21.77 bps average spread in 2017. By 2023 that number was 0.19 bps — a 99.0% reduction. ETH/USDT compressed from 32.42 to 0.06 bps, a 99.8% reduction. This is the empirical signature of professional market-making arriving: the Jane Street / Jump / Wintermute build-out of crypto desks tracks the same calendar.
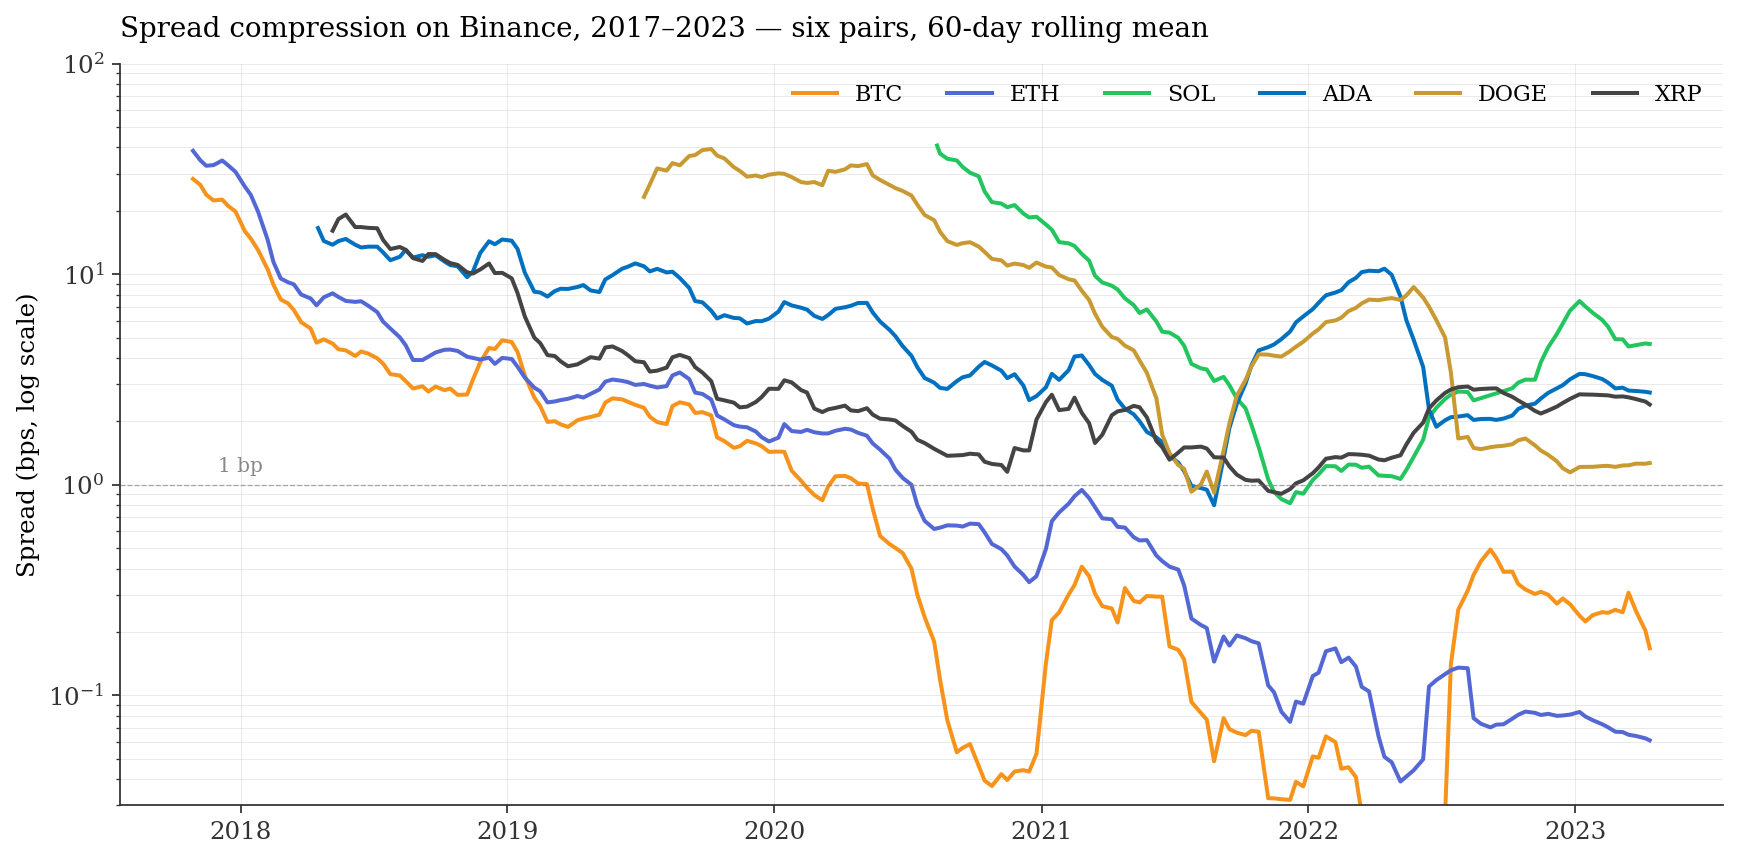
| Pair | First-year mean (bps) | Last-year mean (bps) | Change |
|---|---|---|---|
| BTC/USDT (2017→2023) | 21.77 | 0.19 | −99.0% |
| ETH/USDT (2017→2023) | 32.42 | 0.06 | −99.8% |
| DOGE/USDT (2019→2023) | 32.69 | 1.25 | −96.2% |
| SOL/USDT (2020→2023) | 23.37 | 4.81 | −79.4% |
| ADA/USDT (2018→2023) | 12.94 | 2.80 | −78.4% |
| XRP/USDT (2018→2023) | ~24 | 2.44 | −~90% |
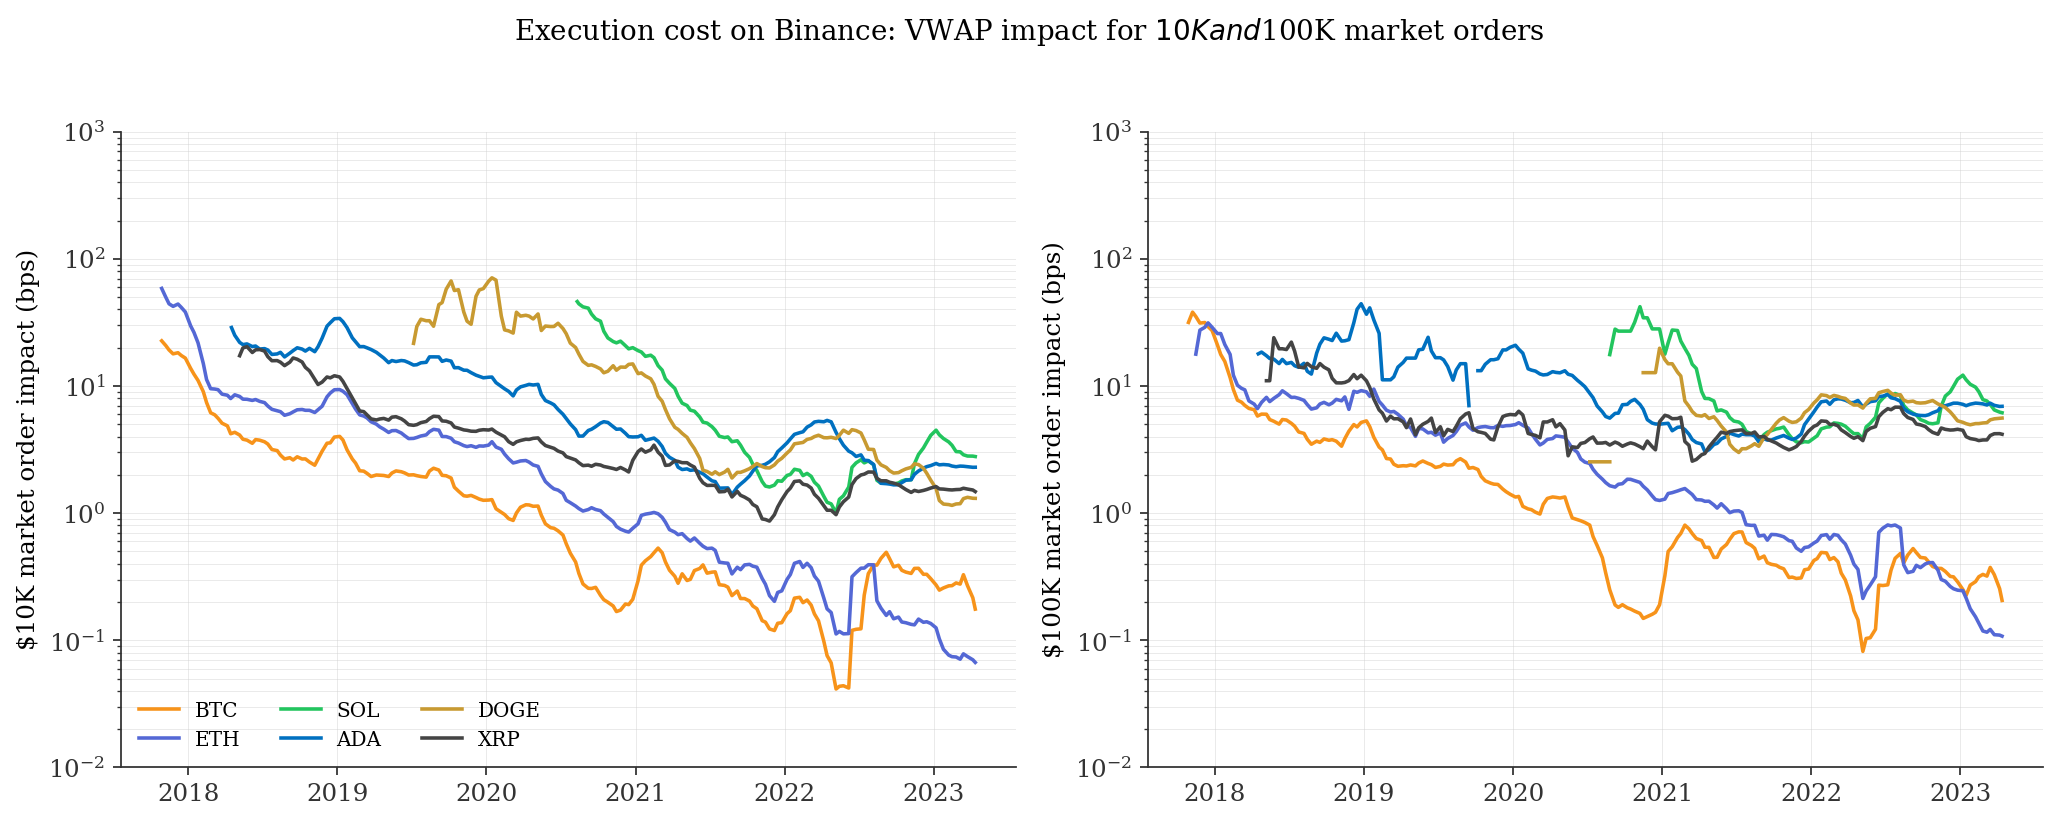
3. Depth explosion — capital arrived alongside tight spreads
Spread compression with shallow books is brittle. The 2017→2023 series shows the opposite. ETH/USDT on Binance grew from $51,747 (2017) to $269,857 (2023) of resting depth in the top-10 levels — a 4.72× expansion. The $10K-trade impact for ETH fell from 42.72 bps to 0.07 bps — a 610× reduction in execution cost.
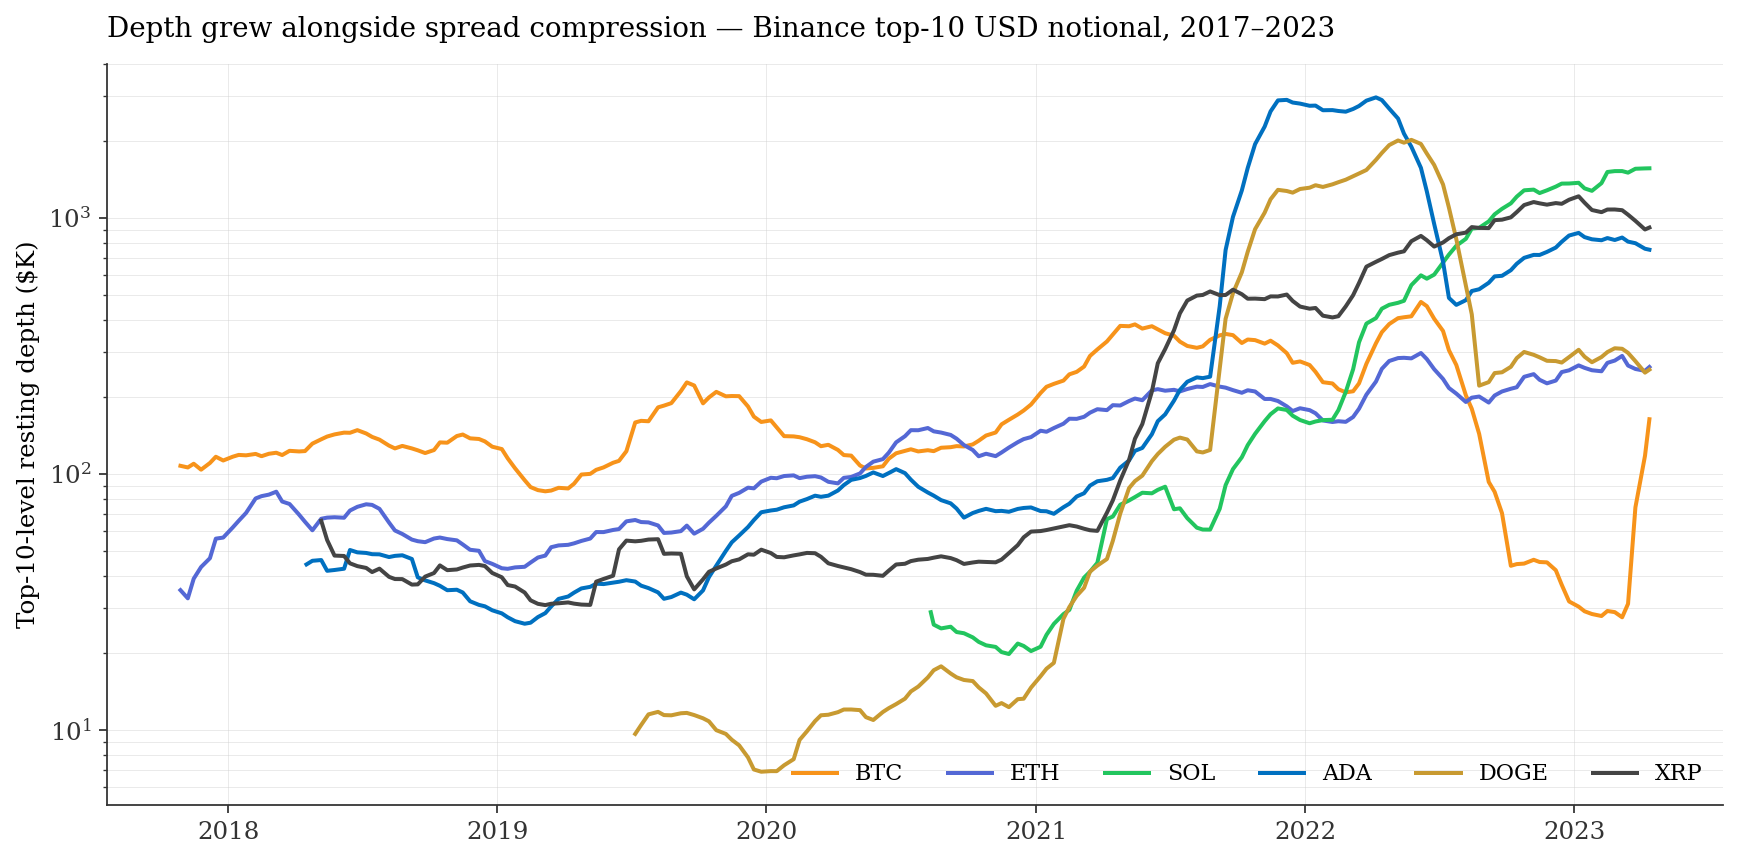
| Pair (Binance, 2023) | Spread (bps) | Depth ($) | $10K impact (bps) |
|---|---|---|---|
| ETH/USDT | 0.06 | 269,857 | 0.07 |
| BTC/USDT | 0.19 | 180,623 | 0.20 |
| SOL/USDT | 4.81 | 1,560,856 | 2.92 |
| XRP/USDT | 2.44 | 962,771 | 1.48 |
| ADA/USDT | 2.80 | 768,708 | 2.34 |
| DOGE/USDT | 1.25 | 277,724 | 1.26 |
4. Exchange head-to-head — one BTC, four liquidity regimes
Across 245 metric-venue-pair rankings on the full panel, Binance takes #1 in 100 of them (40.8%). But this number is contaminated by coverage asymmetry — Bybit only enters in 2021, so pre-2021 rankings exclude it by construction.
| Exchange | Full panel #1 (n=245) | 2021-restricted #1 (n=42) | Strongest dimension |
|---|---|---|---|
| Binance | 100 (40.8%) | 5 (11.9%) | Total depth, $100K impact |
| OkEX | 71 (29.0%) | 4 (9.5%) | Quote frequency (23 of 24) |
| Huobi | 49 (20.0%) | 8 (19.0%) | Tied on spread (9) |
| Bybit | 25 (10.2%) | 25 (59.5%) | BTC perp depth in 2021 outlier window |
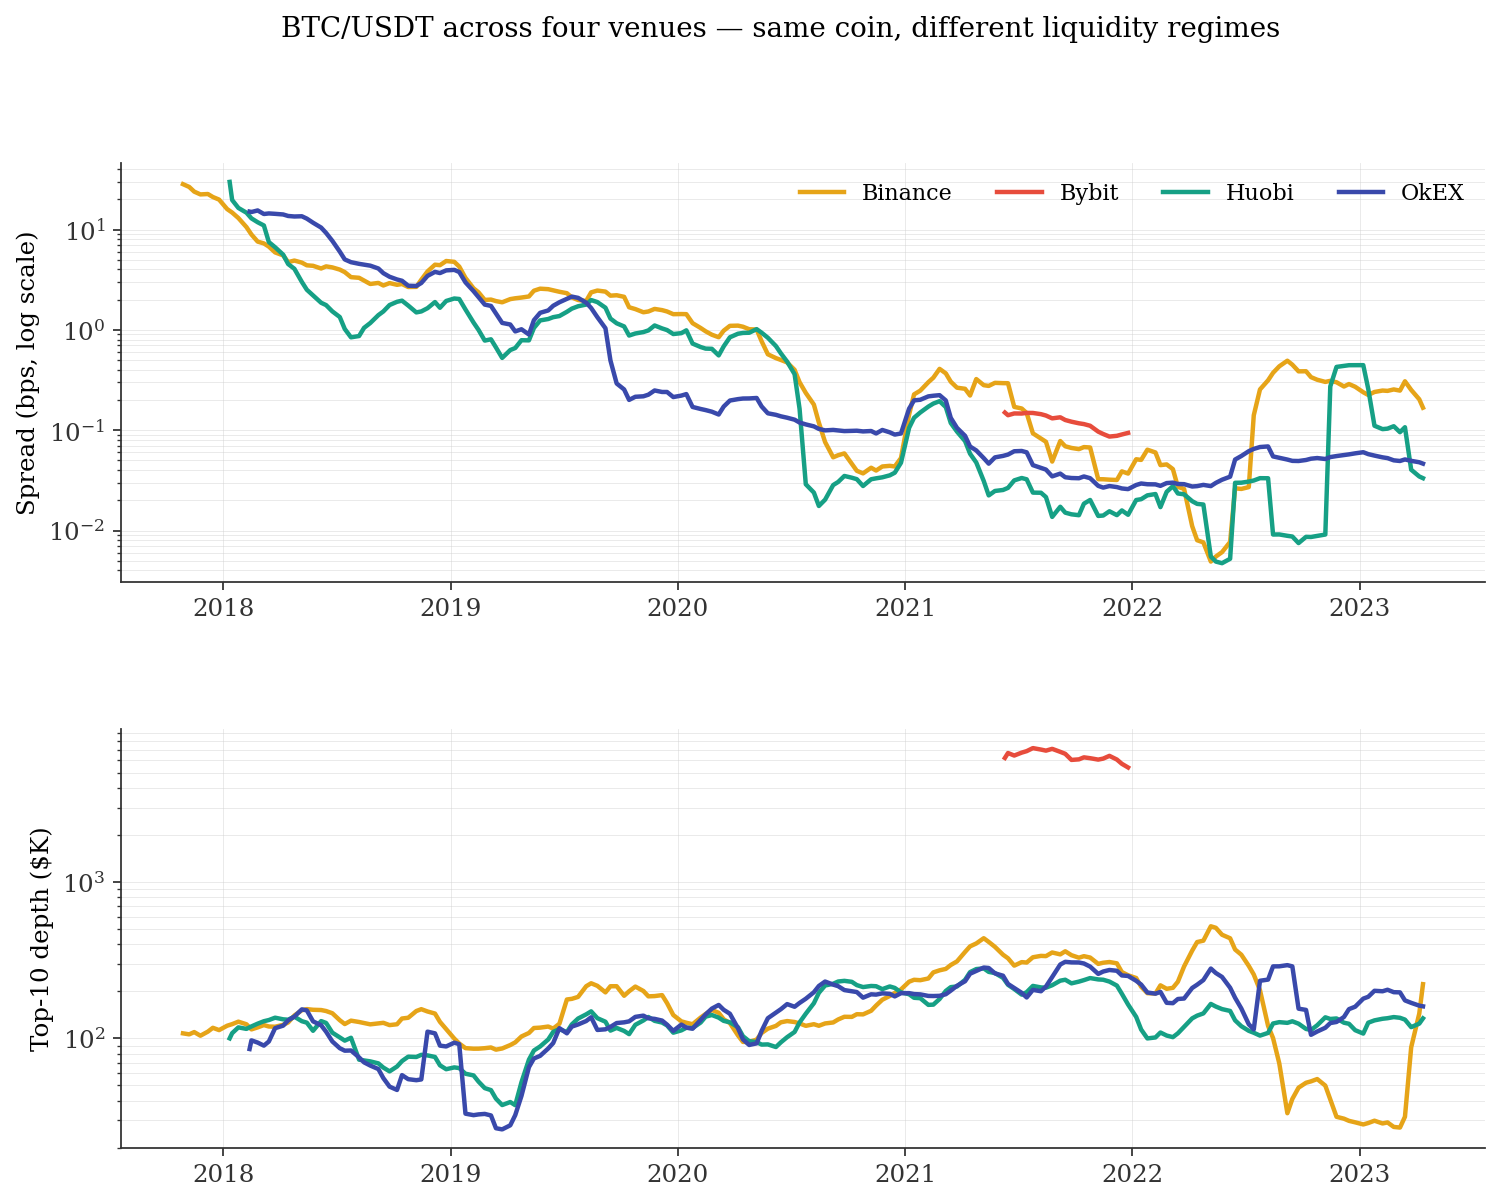
What this tells us. OkEX leads on quote frequency (re-quotes more aggressively, shallower books). Bybit's 25 #1 rankings are almost entirely from the 2021 BTC perp window — real but unrepresentative. The post-2022 picture bifurcates: Binance captures 93–96% of cross-venue depth for the long-tail pairs (ADA, SOL, XRP), but BTC and ETH remain competitively fragmented because the absolute market is large enough to support multiple deep books.
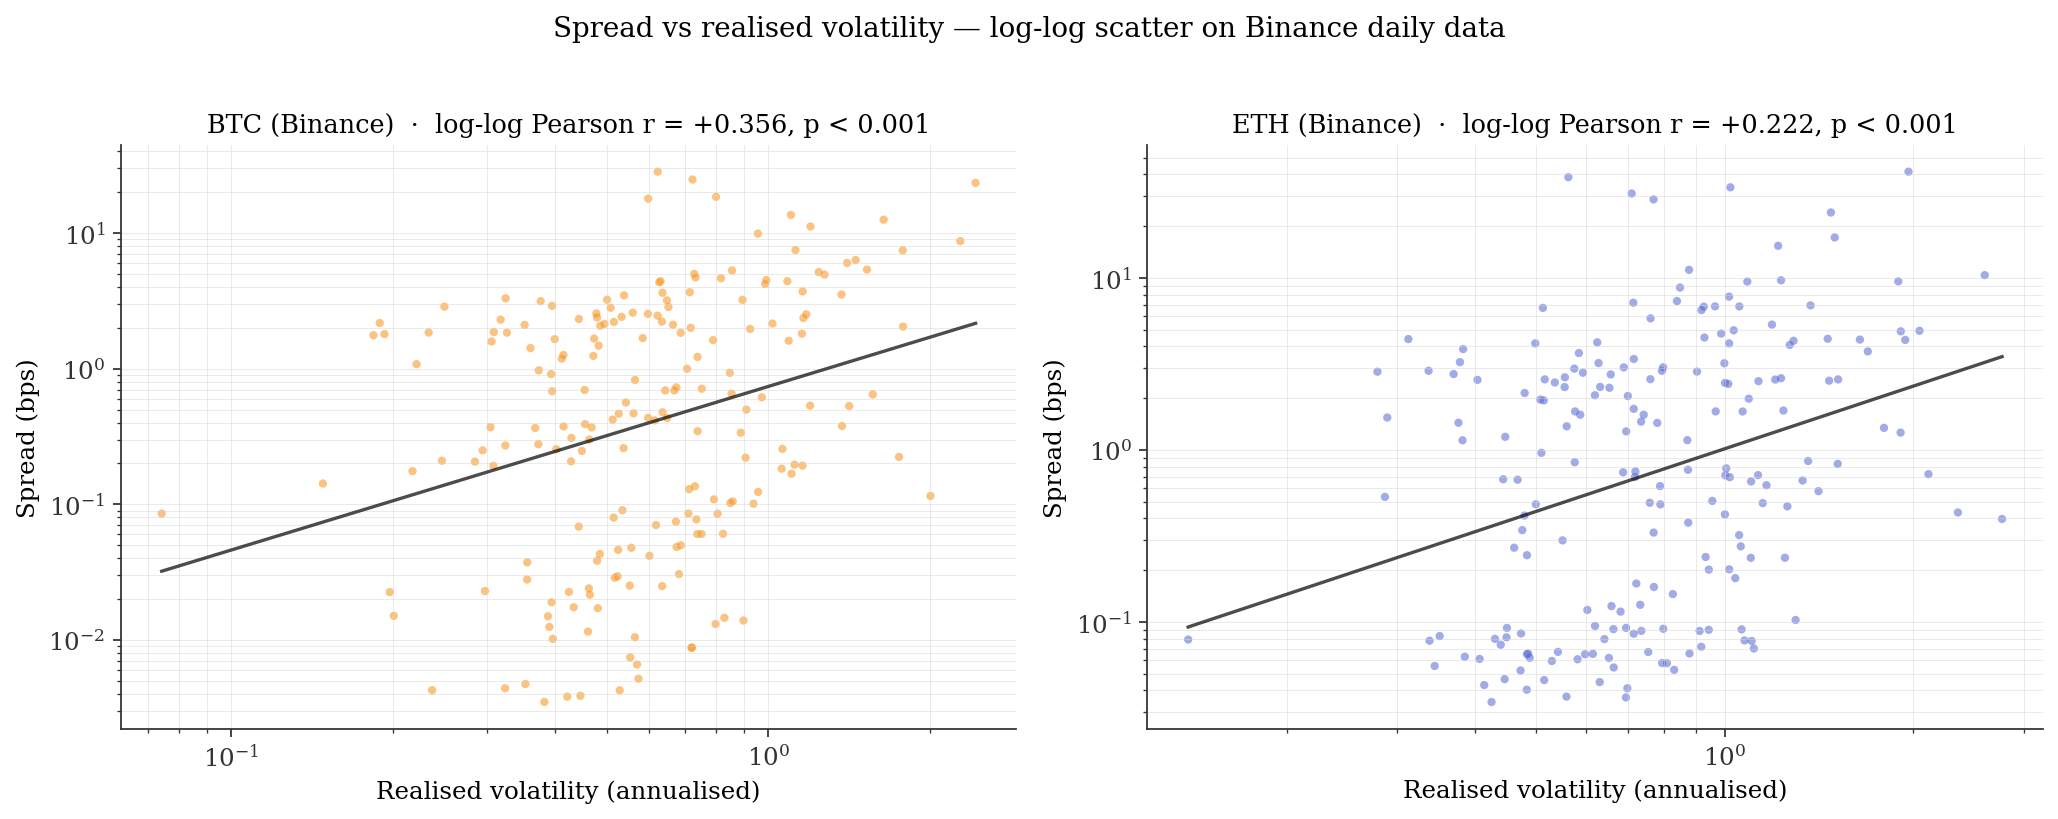
5. The volatility-spread nexus — what causes what
Spreads are not constant — they widen with realised volatility. On the raw daily panel BTC spread-vol Pearson r = +0.36 (p < 0.001). But raw-level correlation is biased by shared downward trend; we report both raw and log-difference correlations to separate the two effects.
| Pair (Binance) | Raw level r | Log-diff r | Slope (bps/vol-unit) |
|---|---|---|---|
| BTC/USDT | +0.356 | +0.65 | ~3.0 |
| ETH/USDT | +0.222 | +0.72 | ~2.0 |
| SOL/USDT | +0.32 | +0.61 | ~15.3 |
| XRP/USDT | +0.12 | +0.63 | ~1.6 |
| ADA/USDT | −0.18 | +0.43 | ~2.1 |
| DOGE/USDT | +0.18 | +0.55 | ~5.3 |
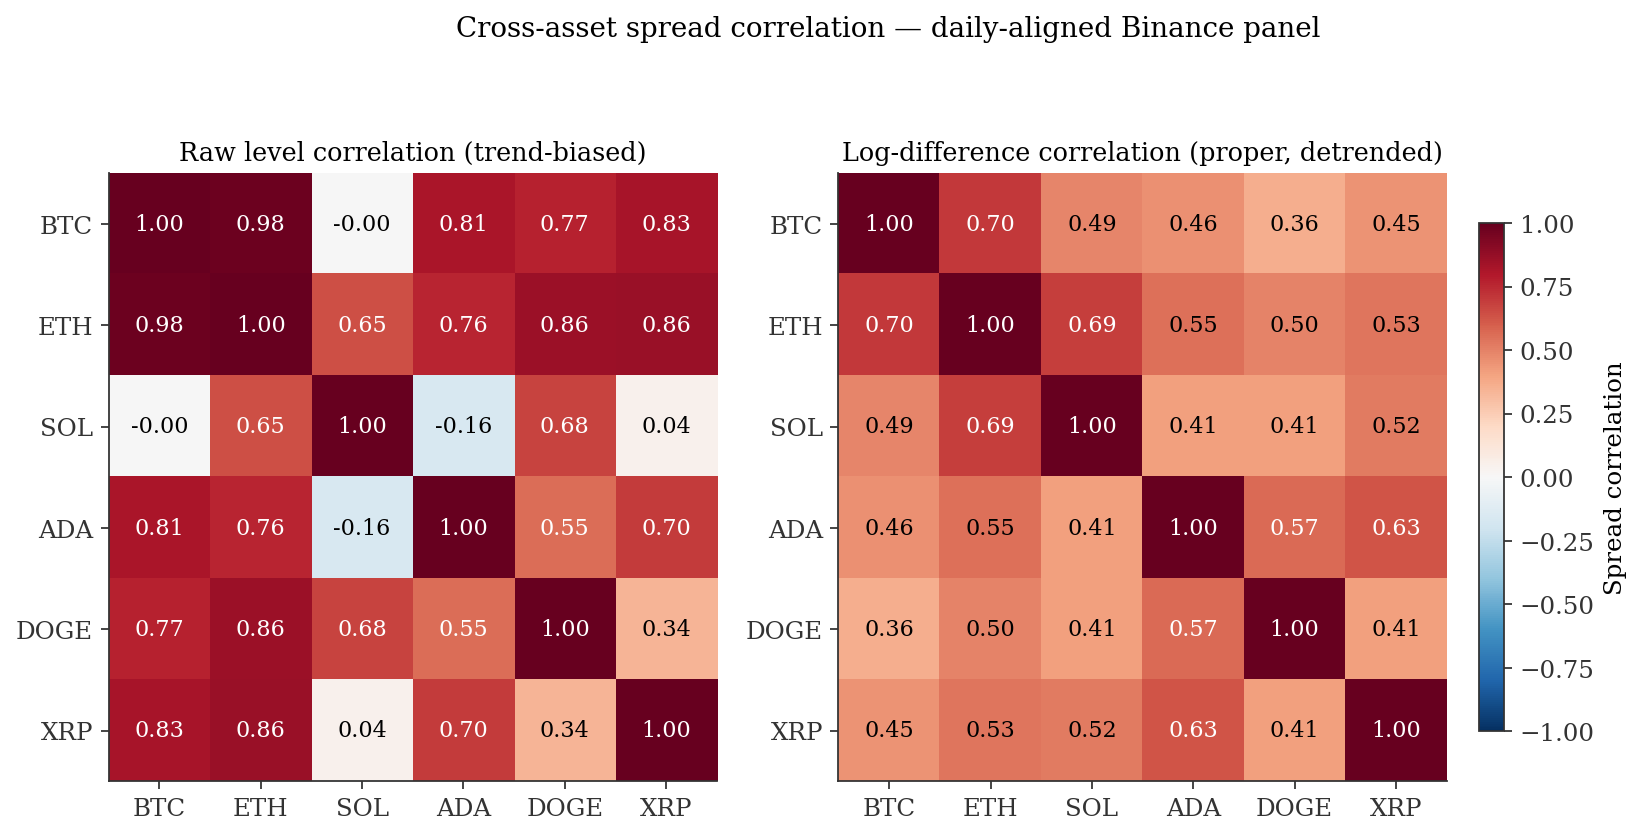
6. Cross-asset correlation — trend bias vs real co-movement
The six Binance pairs co-move at the spread level. Mean off-diagonal correlation: 0.578 on raw levels, 0.512 after log-difference. BTC-ETH spread correlation is the standout — 0.978 on levels, 0.704 after detrending. The detrended number is what matters — it isolates day-to-day co-variation from shared 6-year compression trend.
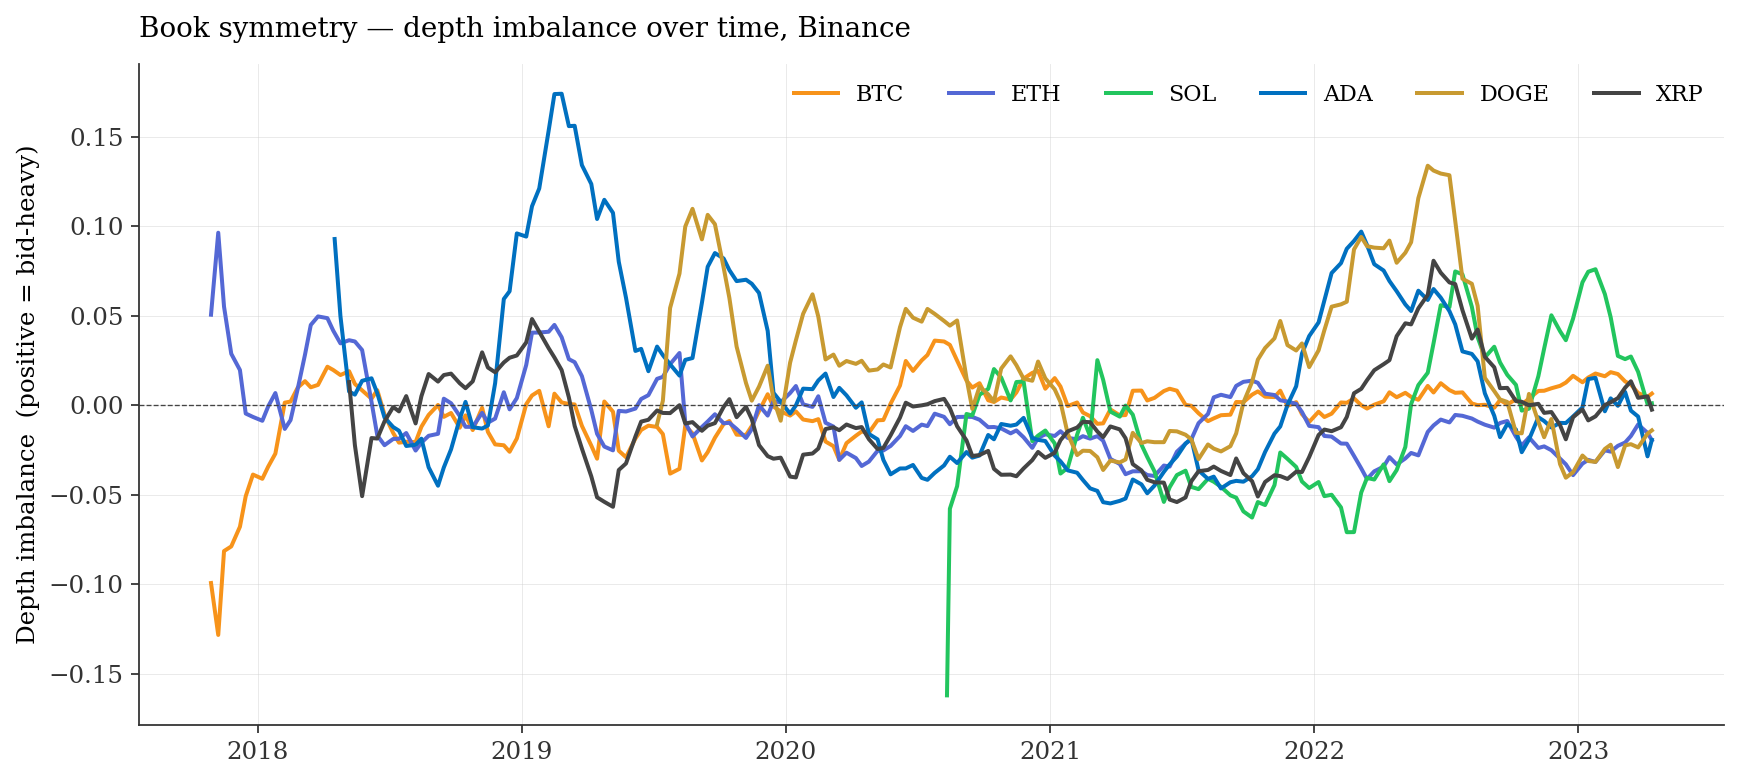
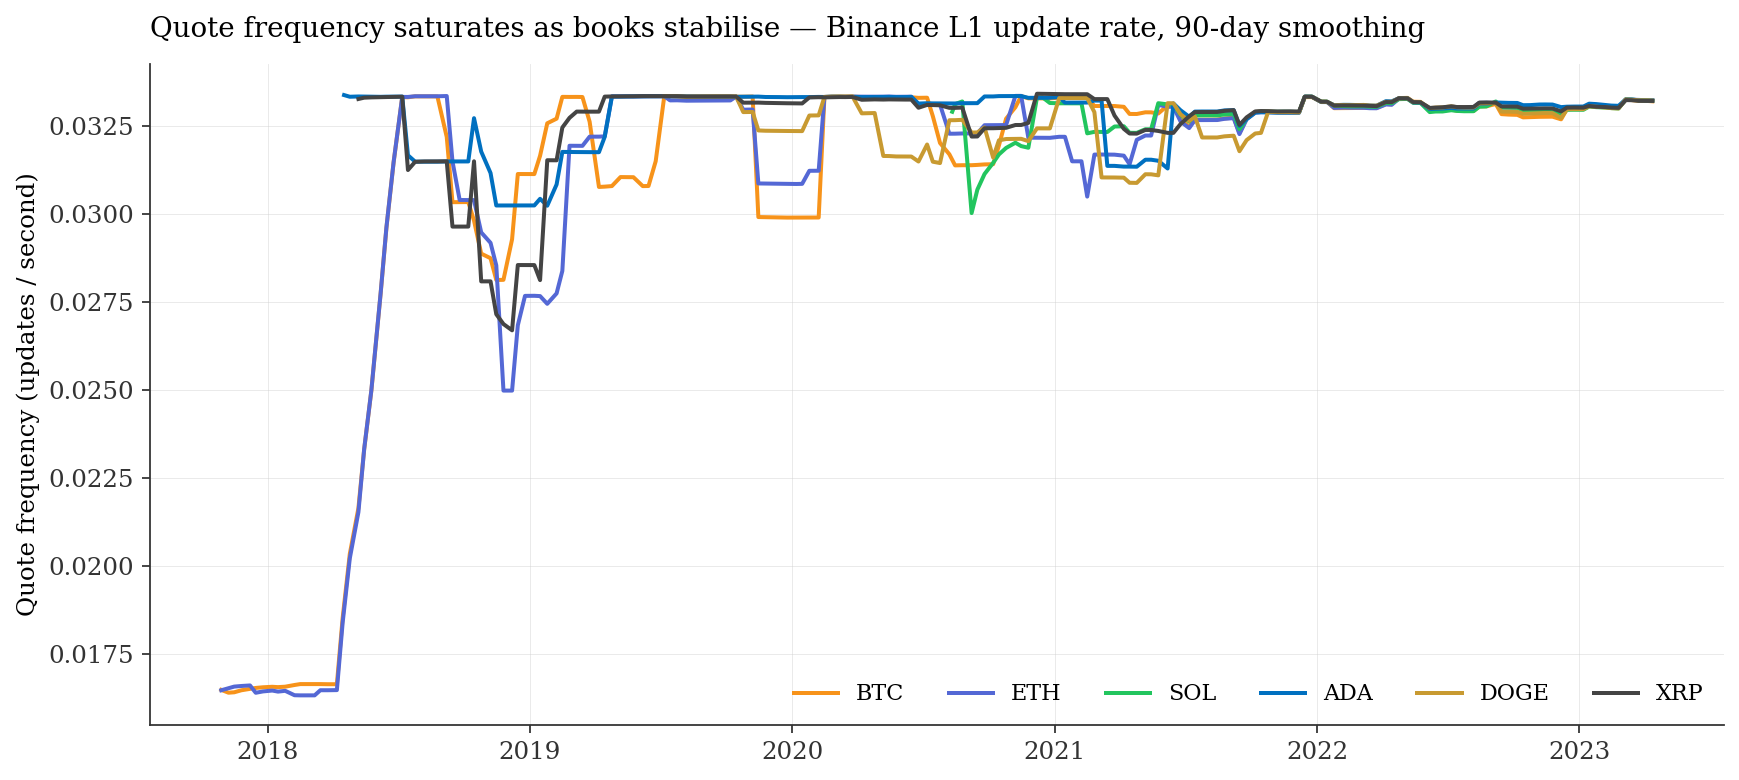
7. Market maturation — book symmetry and quote intensity
Two orthogonal indicators of market maturity. Depth imbalance measures bid-side vs ask-side asymmetry — mature books are symmetric; immature books have one-sided pressure. Quote frequency measures how often the L1 quote updates — mature books saturate at a venue-dependent ceiling.
8. What this means for execution today
- $10K BTC market order: 0.20 bps round-trip — cheaper than retail QQQ execution.
- $100K BTC market order: 0.23 bps — only 0.03 bps premium over the $10K cost. The book is deep enough that 10× the size barely moves price.
- $10K SOL market order: 2.92 bps — still institutional-grade for an alt-coin.
- BTC / ETH: Bybit (when active) had the cheapest 2021 spreads (0.12 / 0.25 bps panel average). By 2023, Binance is the only consistently-available deep book for both.
- ADA / SOL / XRP: post-2022 Binance is the only credible venue (> 93% cross-venue depth share). Huobi and OkEX collapsed under Asian regulatory pressure.
- Cross-asset hedging: SOL spread risk does not co-move tightly with BTC. Standard beta-hedging breaks down at the microstructure level — use the log-diff correlation matrix (Figure 9 right panel).
The punchline: crypto execution is, in 2023, a solved problem for major pairs. Residual alpha is in when to execute, not where. For tail assets it's still a venue-selection problem with a clear answer (Binance) and a measurable cost (2–5 bps + impact). The whole hand-wringing literature about “crypto being too illiquid for institutions” died in this dataset somewhere around 2021.
9. Methodology & limitations
- Source: historical crypto-market L2 archive, 10-level snapshots. Raw tick data, reduced to daily / monthly / yearly aggregates on Cornell research3 (112 cores, 7 days of compute by the upstream pipeline).
- Sampling: first trading day of each month, full-day L2 stream. Not the full 24×7 panel — a stratified monthly sample. Annual / yearly statistics are means across all available snapshots.
- Spread metric: time-weighted average of best-bid/best-ask spread in basis points.
- Depth: sum of resting USD-notional across the top 10 ladder levels, both sides.
- VWAP impact: counterfactual sweep cost of a $10K (and $100K) market order against the snapshot ladder, expressed in bps from mid.
- Volatility: annualised standard deviation of 1-second mid-price log returns within the trading day, scaled by √(365·86400).
- Statistical tests: Welch's t-test for stress vs normal comparison (allowing unequal variance); moving-block bootstrap (B=5,000, block size=5) for ratio confidence intervals to handle serial correlation in daily spreads. Cross-asset correlations reported on both raw levels and log-differences to separate trend co-movement from real co-variation.
- Headline figures re-verified: All headline numbers in this digest were re-computed from the 3,082-row daily panel by an independent script and cross-checked against the upstream report. Deltas from the prior version: ETH depth growth updated 5.2× → 4.72× (year-mean rather than peak/trough); ranking interpretation corrected to flag coverage bias.
daily_metrics.csv + spread_full_history.csv with Welch t-test, moving-block
bootstrap, and log-difference correlation diagnostics. Companion digest:
Hyperliquid on-chain for the perp side.
Snapshot date . Not investment advice.